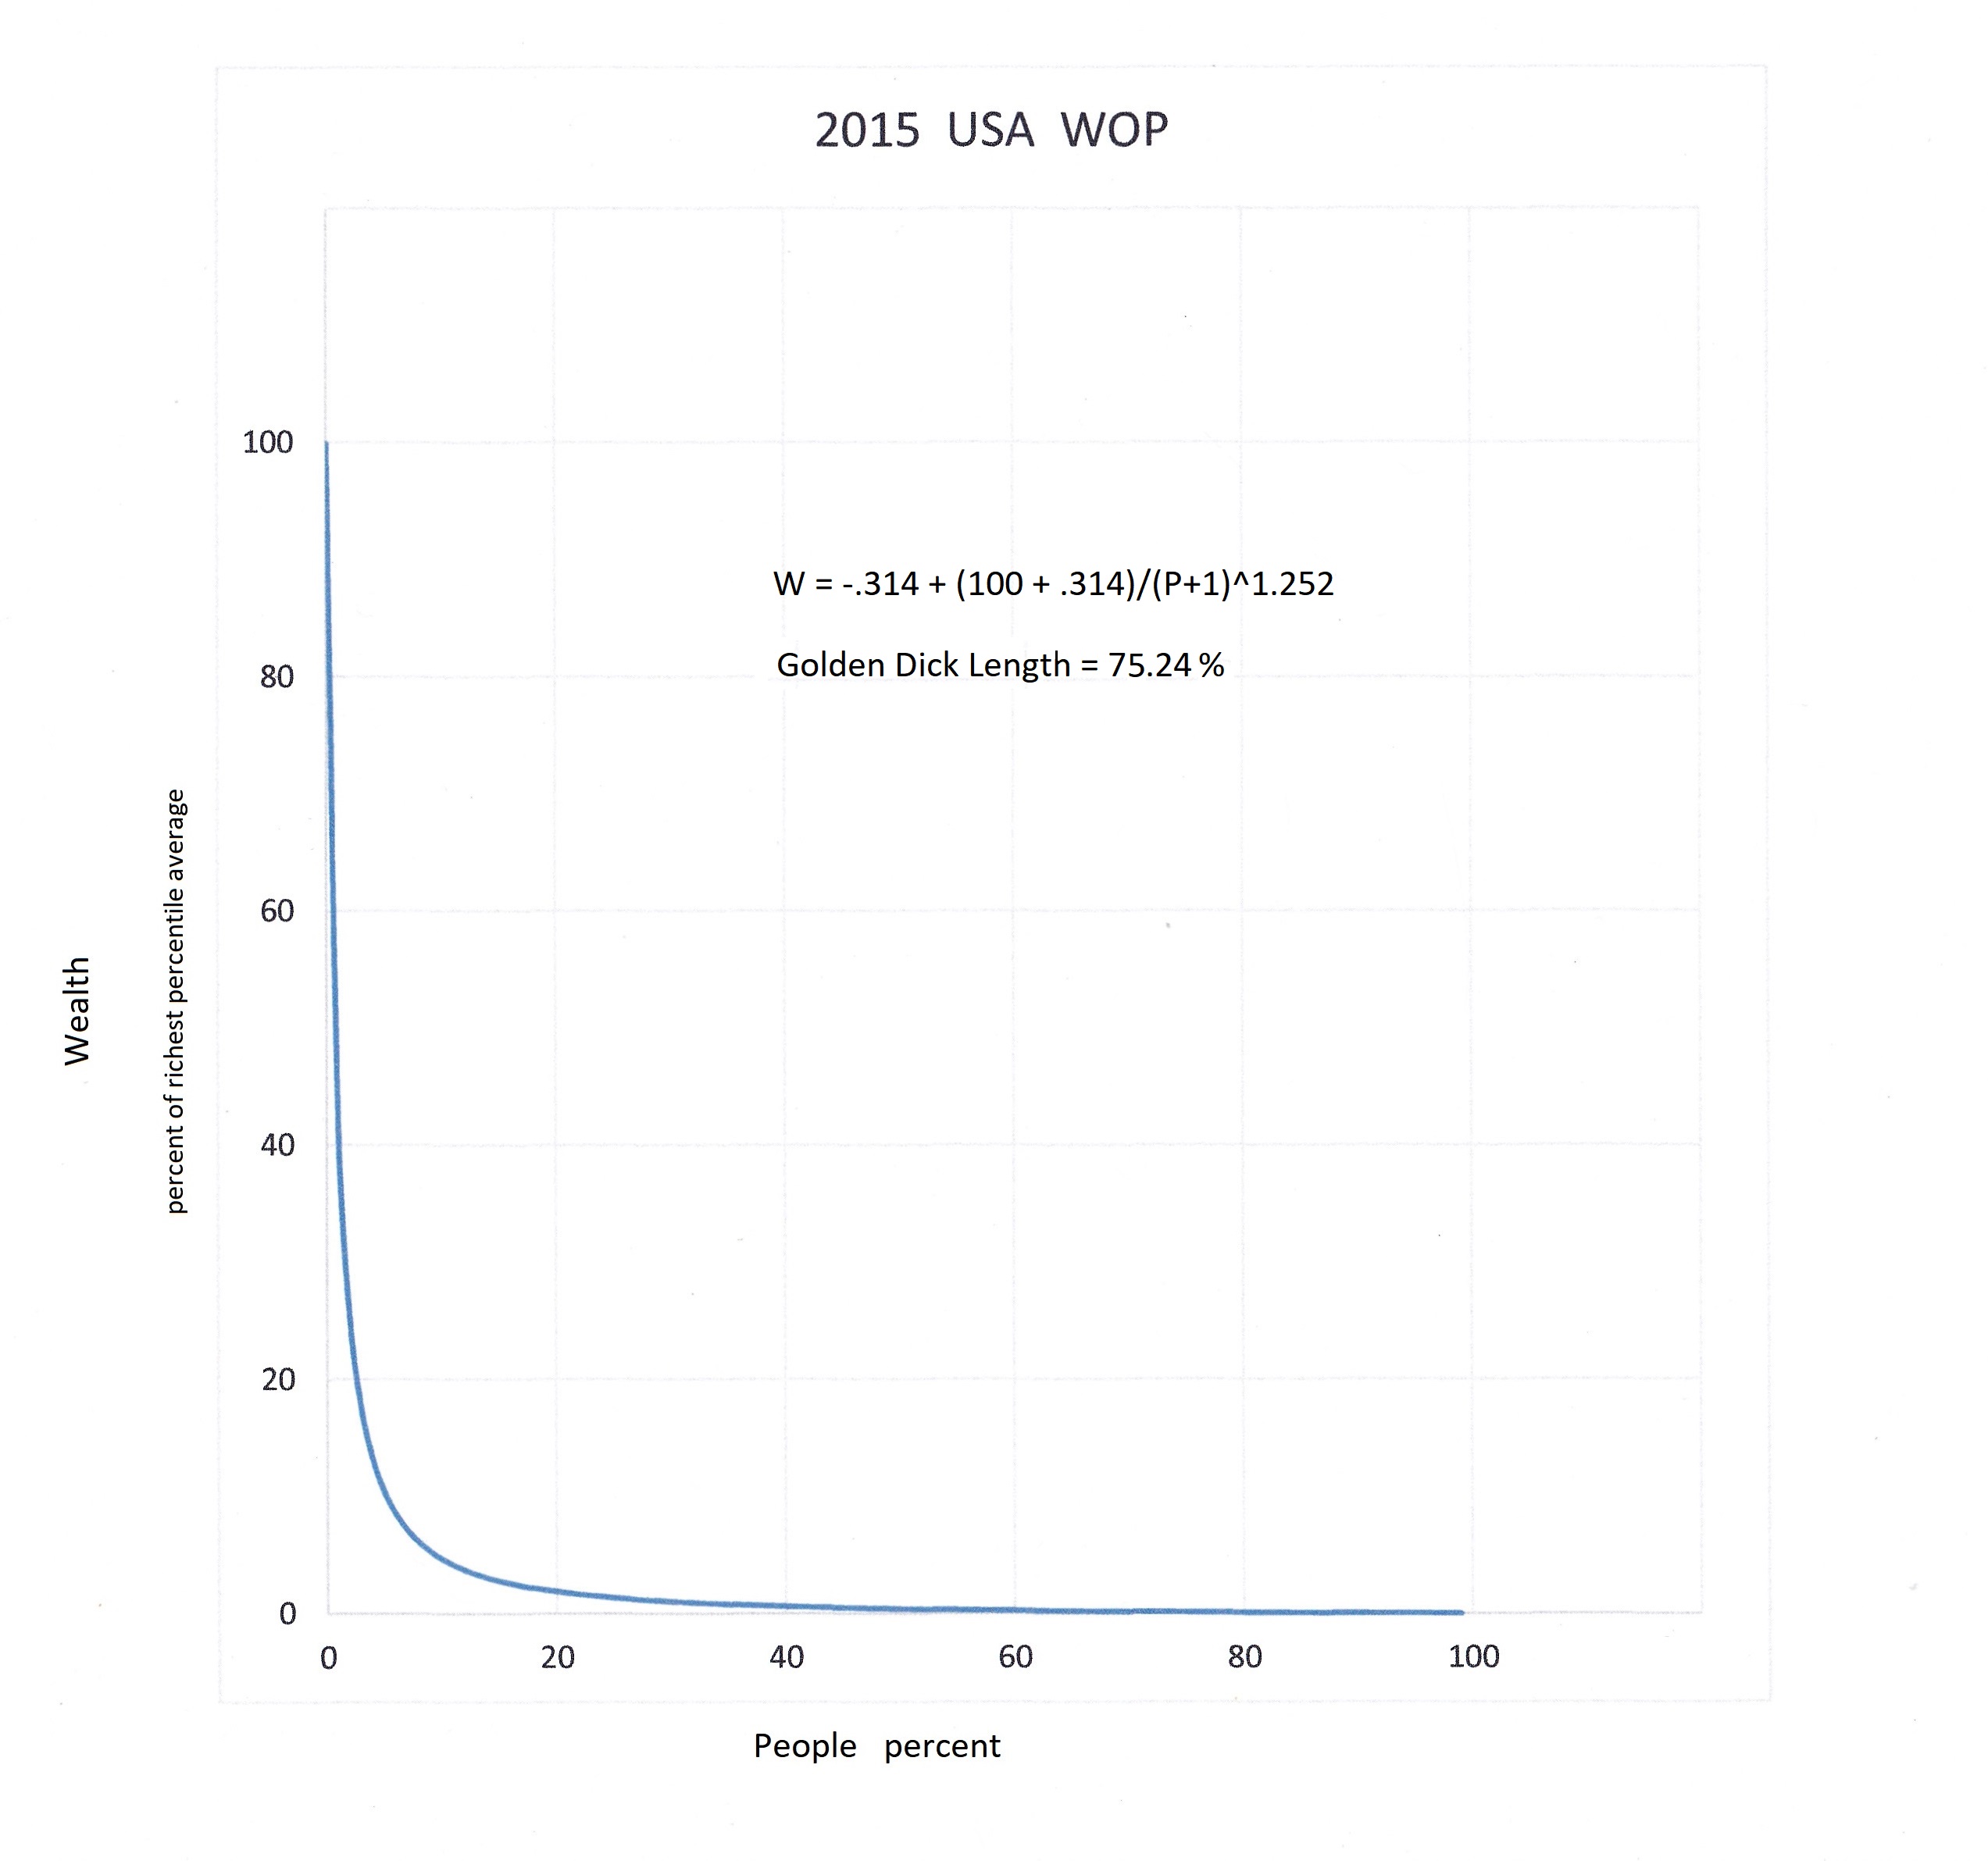

A wop graph is a graph of the "relative" distribution of wealth within a nation. The vertical scale expresses wealth as a percentage of the average wealth of the richest percentile. In a backward nation, that average wealth of the richest percentile might be 100 cows. In a large, advanced nation that same top-left point might be worth ten billion dollars. The horizontal scale assumes that the people have been lined up from the richest (at left) to the poorest (at the 100% mark). For any nation two points of the graph are known before any data are gathered. The point at the top-left is there by definition. The point at the bottom-right is known from hard reality (there is always at least one percent of the populace that are either very sick or incarcerated and thus have no wealth). Above each people percentile, their dot on the curve shows how the average wealth of that percentile compares with that of the richest percentile.
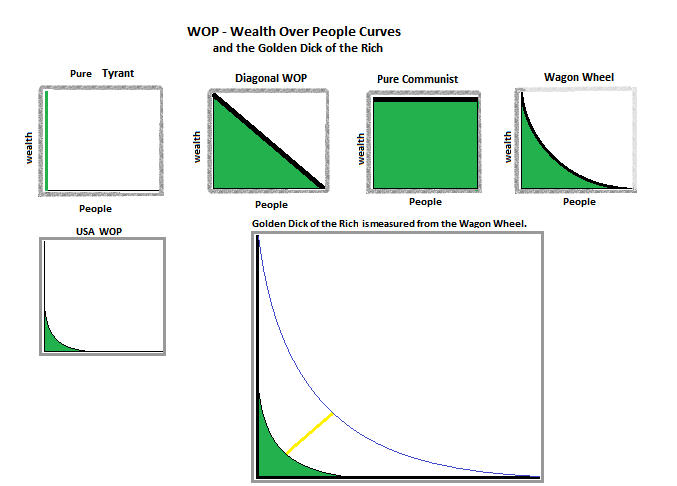
As you see in the image above, there are several classic forms of the WOP. There is the Pure Communist wop. It is a square. The Diagonal wop shows an economy where a family at the median (50%) has one half the wealth of a family in the richest percentile (the zeroth percentile). The Pure Tyrany wop is a vertical green line at the first percentile. That is, all of the nation's wealth is held by the people in the richest percentile. All the other citizens of that nation are either slaves or serfs (they own nothing). As you can see, the USA wop most closely resembles the Pure Tyranny form.
Whatever the initial form of a nation's wop, there is always a suction applied to it from the graph origin. (Imagine a vacuum tube hooked into the graph origin.) This suction exists for three reasons: 1)Takes $ to make $. 2) Massive inheritance. 3)The rich (like everyone) hate paying taxes. But (unlike the rest) the rich can afford to bribe judges and politicians to move the tax burden off of themselves and onto the middle and lower classes. Unless countered, this triple threat causes the curve to move inward over time more and more closely aproaching the pure tyrant form. As you can see, this process has worked very effectivly on the US wop. Among developed nations, only Switzerland and Denmark have slightly more tyrannical wops.
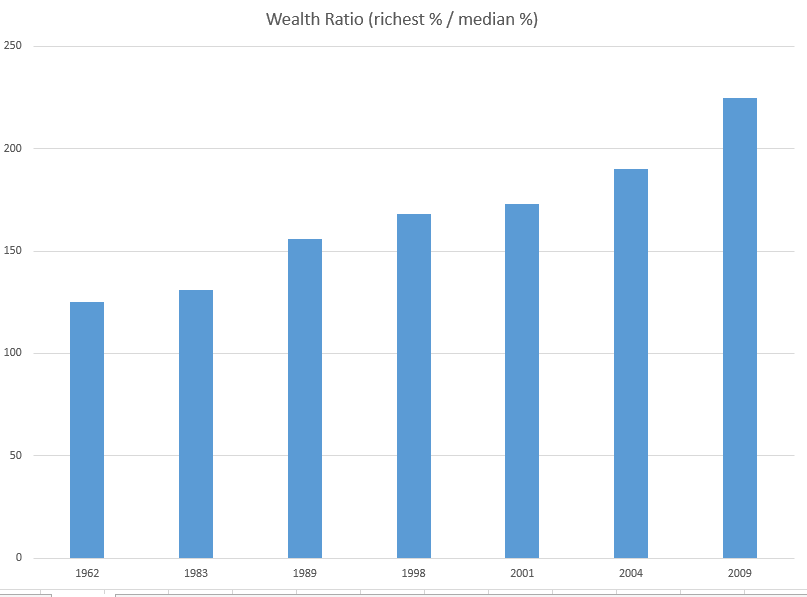
So, our question becomes . . . Is there some compelling form of the WOP between the diagonal and the Pure Tyrant? Is there some form of the curve at which the people can say, "You may corrupt our economy this far but no further?" And our answer is, "Yes!" That compelling wop form is the Wagon Wheel WOP." It is a quarter circle of radius 100. It is tangent to both the top-left and the bottom-right points. Under a Wagon Wheel wop the average wealth of the rich is only 6.5 times that of the median family. Compare this with the wealth ratios (wealth of top % devided by wealth of median %) below.
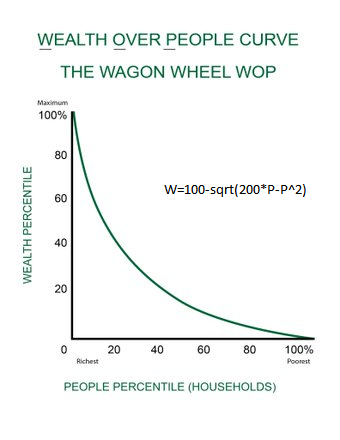
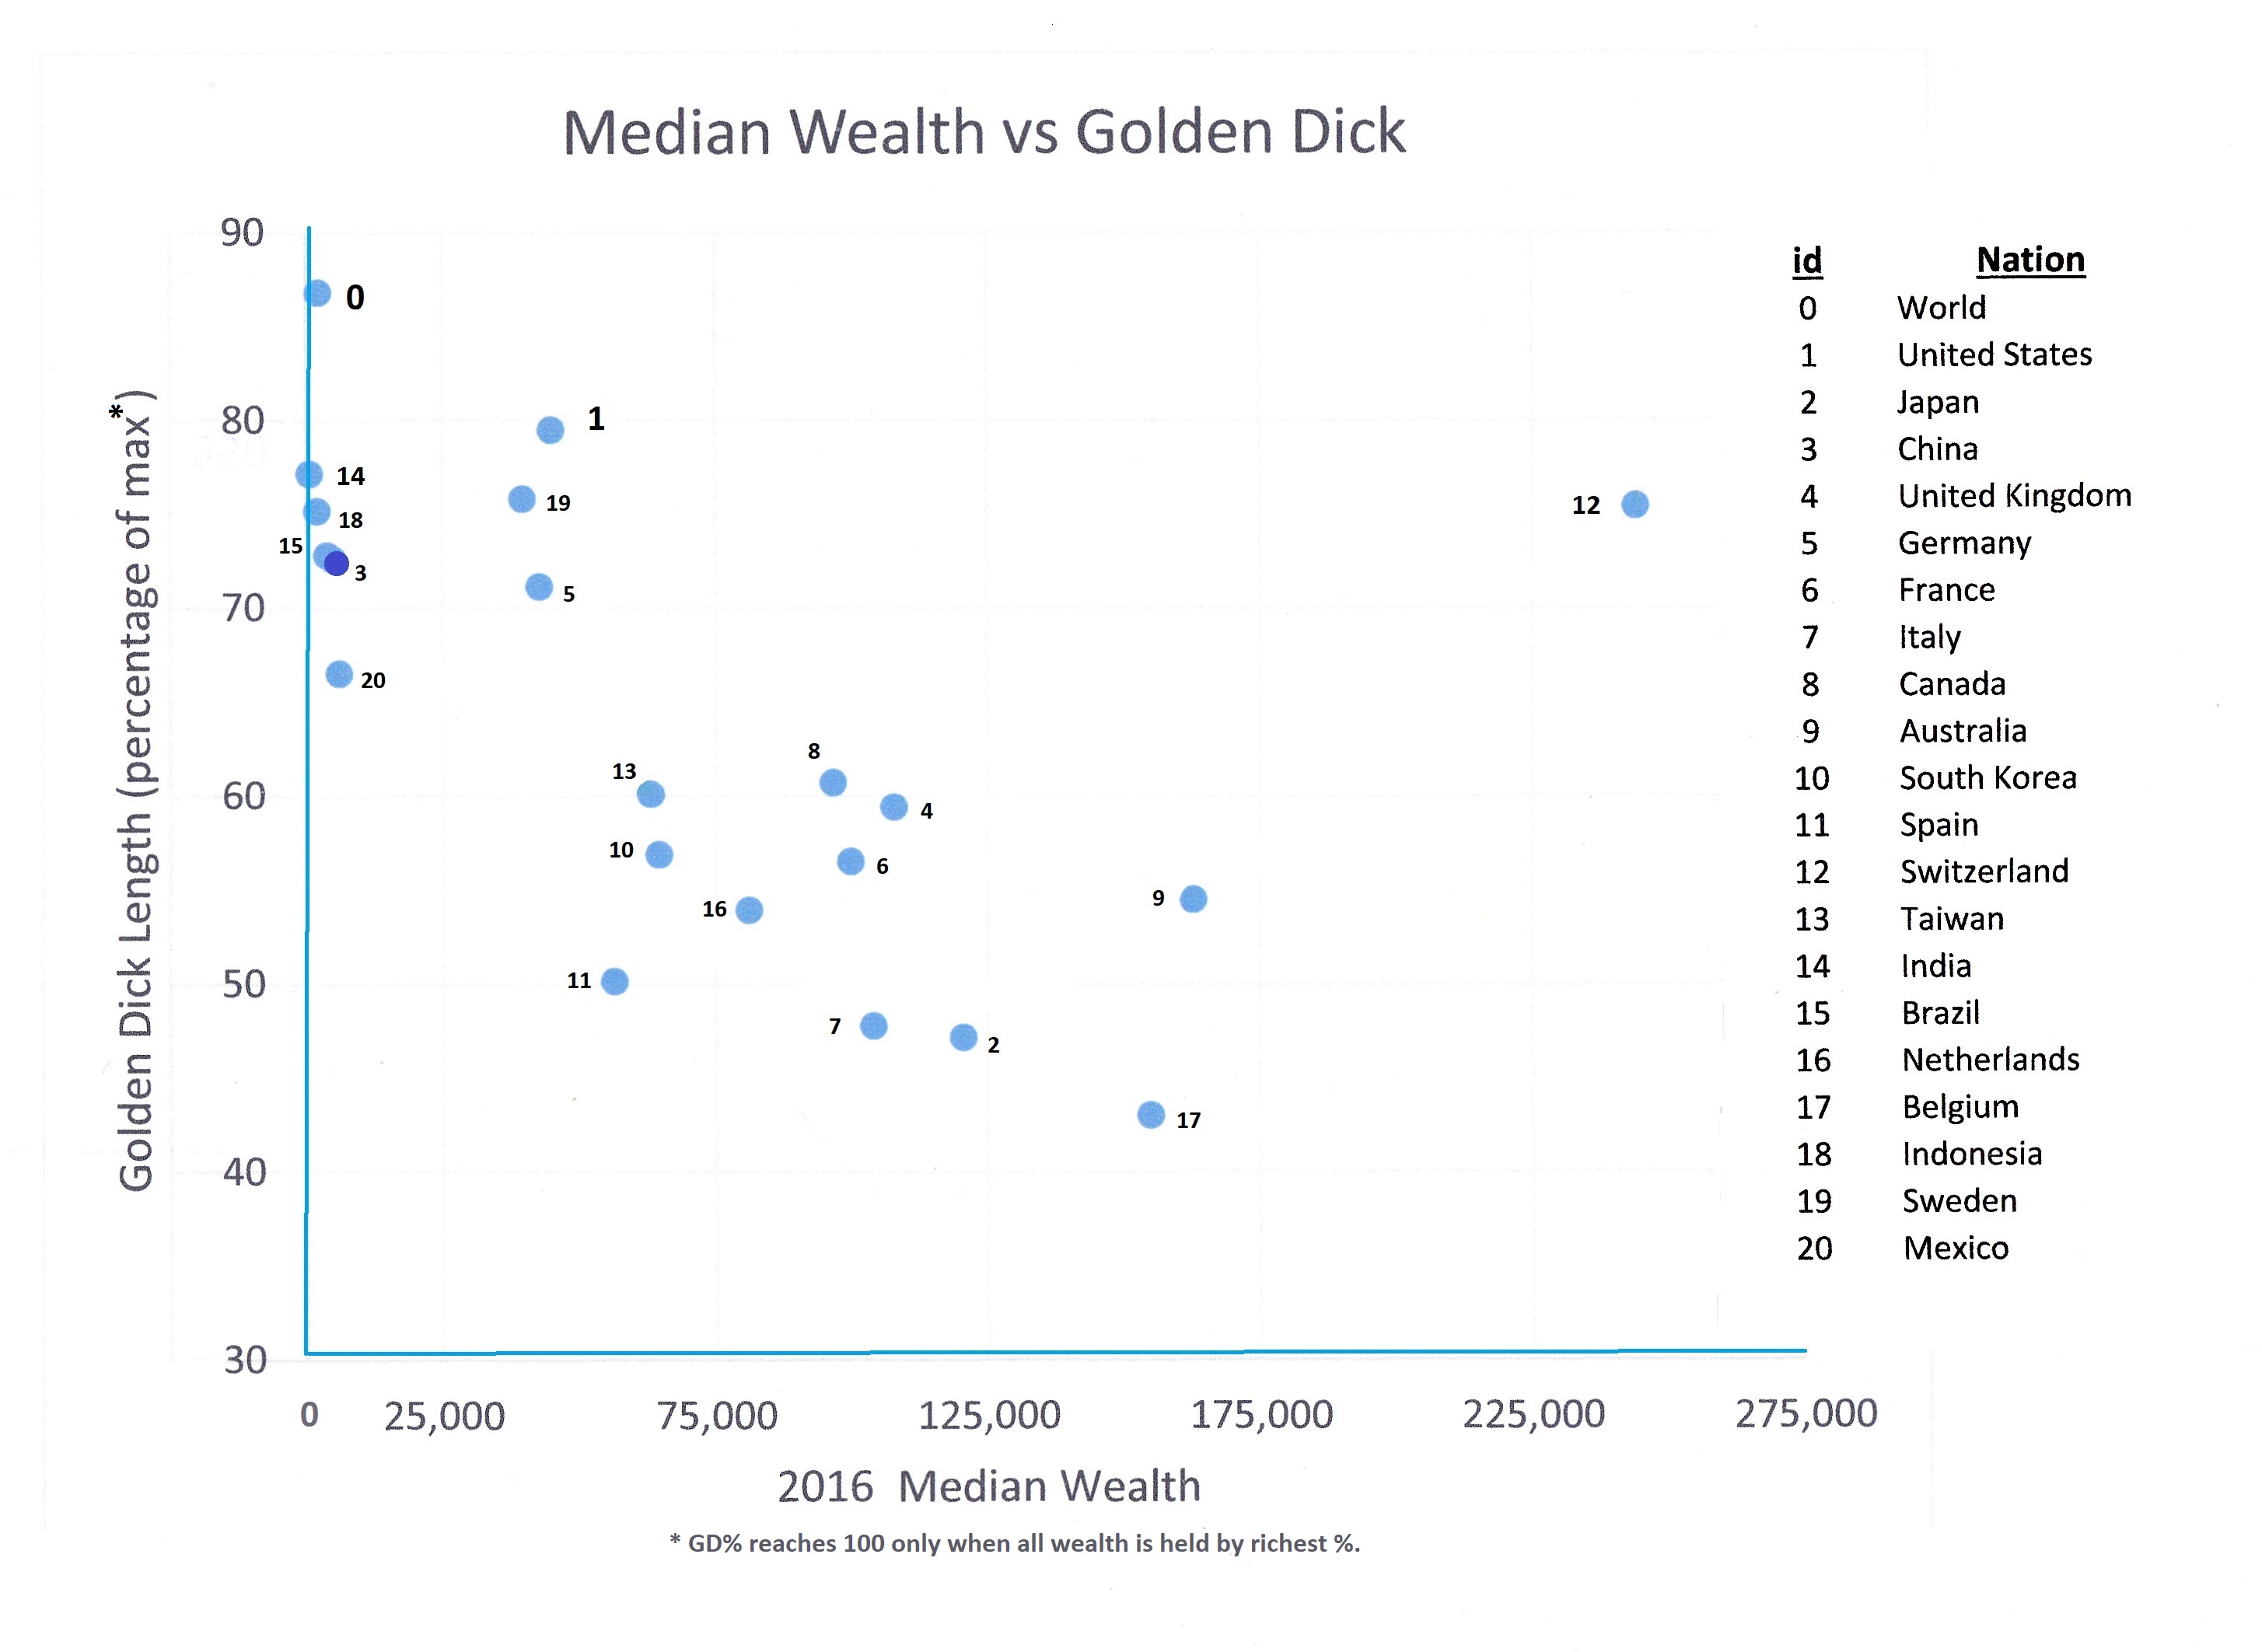
It is my feeling that the citizens of a nation who become aware that they are being screwed by their rich should not rest until they have changed their tax and economic system so that their wop has achieved the Wagon Wheel form. The Golden Dick of the Rich is a new measure of economic injustice. It is the relative distance (along the diagonal) from the Wagon Wheel to the wop of the subject nation. A "GD" of 100% only occurs when the rich have managed to convert an economy into a pure tyranny. The GD for the United States in 2009 was 71%. Using 2015 data from Wikipedia, our GD had grown to 75%.
moa = median wealth/average wealth.
These data are usually available (but may be corrupted).
TpSh = Share of the nations wealth held by the richest percent = .4524 -.936*moa + .5*moa^2
The Gini coefficient is a much older measure of economic disequity. Gini = .947 - .63*moa
P is the People index. It starts at zero (the start of the column for the richest percentile) and goes to 99 (start of the poorest percentile).
pwr = 1.55-2.4*moa+.9*moa^2 pwr is the exponent applied to the People index P.
T = tail value = 405/(Pwr+1)^9
W = relative Wealth of a percentile of the People = -T + (100+T)/(P+1)^pwr
The maximum length of the Golden Dick of the rich is 41.421 units. That is 100%. That’s the distance along the 45 deg line from the wagon wheel curve to the origin. The GD reaches its maximum only in a Pure Tyranny.
For any other wop the GD length is the distance (along the 45 deg line) from the wagon wheel to the subject wop. So the subjects GD is 41.421 less the distance (along the 45) from origin to the subjects wop. Given the pwr of a wop, the People value, Px, where it crosses the 45 deg line is calculated by
Px = -0.4742pwr^3 + 4.6222pwr^2 -15.5949prw + 20.4655
Then the distance along the 45 from origin to this wop is sqrt(2*Px^2)
So the length of the GD is 41.421 - sqrt(2*Px^2)
And the percent length of the GD is 100 [1 - .02414*sqrt(2*Px^2)]
A good, fast estimate for GD% is given by GD% = 90.3 - 82.66*moa.
Note that in some cases (for example, the diagonal wop) the GD may be negative.